Warning
This documentation is under active development. Some sections may be incomplete.
Charging Scenarios#
This section describes the various electric vehicle charging scenarios supported by the Fleet Electrification BC framework.
Scenario Overview#
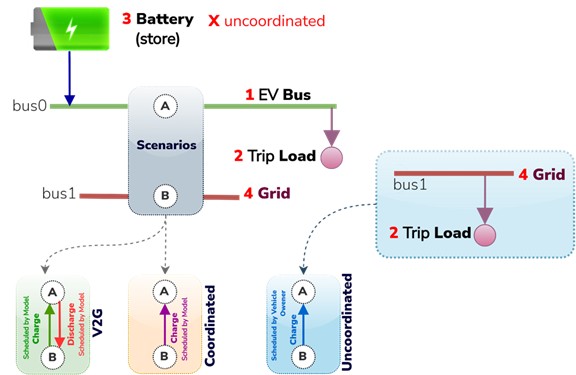
The framework supports multiple charging strategies to analyze different grid integration approaches:
Coordinated Charging: Optimized scheduling for grid benefits
Uncoordinated Charging: User-driven charging patterns
Vehicle-to-Grid (V2G): Bidirectional energy flow
Hybrid Strategies: Mixed coordinated/uncoordinated approaches
Hybrid Coordinated-Uncoordinated Strategy#
🔄 Configuration#
The hybrid strategy allows simulation of mixed charging behaviors with varying coordination levels:
# Example hybrid configuration
hybrid_scenarios = [
    (10, 90),   # 10% coordinated, 90% uncoordinated
    (30, 70),   # 30% coordinated, 70% uncoordinated
    (50, 50),   # 50% coordinated, 50% uncoordinated
    (70, 30),   # 70% coordinated, 30% uncoordinated
    (90, 10),   # 90% coordinated, 10% uncoordinated
]
Assumptions#
100% of EV load is active in the simulation
The load is split between coordinated (x%) and uncoordinated (y%) portions
The condition
x + y = 100%must always holdEach scenario represents a different market penetration of smart charging
Expected System Response#
📈 As Coordinated Charging Increases#
Metric |
Behavior |
Investigation Focus |
|---|---|---|
🧱 Required Firm Capacity |
↓ Decreases |
Less peaking capacity needed due to load shifting |
☀️ Renewable Utilization |
↑ Increases |
Better alignment with solar/wind generation |
💰 System Cost |
↓ Decreases |
Lower operational and investment costs |
🧮 Flexibility Value |
↑ Increases |
Enhanced grid stability and price arbitrage |
Coordinated Charging Benefits#
Smart Charging Advantages
✅ Load Shifting: Optimizer moves EV charging to optimal periods
✅ Renewable Integration: Charging aligns with solar/wind availability
✅ Peak Reduction: Avoids expensive peaking generation
✅ Grid Support: Provides flexibility services to the power system
Uncoordinated Charging Challenges#
Uncoordinated Charging Issues
❌ Peak Demand: Sharp evening peaks (6-9 PM) increase system stress
❌ Infrastructure Strain: Higher peak demand requires more capacity
❌ Renewable Curtailment: Poor alignment with renewable generation
❌ Higher Costs: Increased need for expensive peaking resources
Elbow Curve Analysis#
🔮 Diminishing Returns Pattern#
The relationship between coordination level and required Variable Renewable Energy (VRE) capacity typically shows:
Expected Coordination Phases#
Initial Gains (0% → 40%)
Significant drop in required VRE overbuild
Efficient use of existing renewable capacity
Major system cost reductions
Middle Range (40% → 70%)
Continued benefits but slower improvement rate
Some VRE redundancy still present
Moderate additional cost savings
High Coordination (70% → 100%)
Diminishing returns on additional coordination
Flexibility nearly maximized
VRE capacity requirements level off
Factors Affecting the Elbow Point#
Temporal Overlap: Alignment between EV charging needs and VRE generation
Grid Flexibility: Existing system flexibility resources
Curtailment Levels: Amount of renewable energy currently curtailed
Load Patterns: Regional demand characteristics
Charging Strategy Configurations#
Coordinated Charging#
fleet_EV_args = {
    'ev_charging': "coordinated",
    'ev_population': 0.8,
    # Additional coordinated charging parameters
    'optimization_horizon': 24,  # hours
    'price_signals': True,
    'grid_constraints': True,
}
Characteristics:
Centralized optimization
Grid-aware scheduling
Price-responsive charging
Renewable energy alignment
Uncoordinated Charging#
fleet_EV_args = {
    'ev_charging': "uncoordinated",
    'ev_population': 0.8,
    # Uncoordinated charging follows natural patterns
    'user_behavior': "immediate",  # or "convenience"
    'location_preference': "home_dominant",
}
Characteristics:
User-driven timing
Immediate charging preference
Evening peak loading
No grid optimization
Vehicle-to-Grid (V2G)#
fleet_EV_args = {
    'ev_charging': "v2g",
    'ev_population': 0.8,
    # V2G specific parameters
    'discharge_capability': 0.5,  # 50% of vehicles can discharge
    'min_soc': 0.2,  # Minimum state of charge
    'grid_services': True,
}
Characteristics:
Bidirectional energy flow
Grid support services
Enhanced flexibility
Battery degradation considerations
Scenario Implementation#
Running Multiple Scenarios#
import itertools

# Define scenario matrix
coordination_levels = [10, 30, 50, 70, 90]
ev_penetrations = [0.5, 0.8, 1.0]

# Run scenario combinations
for coord, penetration in itertools.product(coordination_levels, ev_penetrations):
    scenario_args = {
        'coordination_percent': coord,
        'ev_population': penetration,
        'scenario_name': f'coord_{coord}_pen_{int(penetration*100)}'
    }
    # Run simulation with scenario_args
Scenario Comparison#
The framework automatically generates comparison visualizations:
Capacity Requirements: Generation capacity by scenario
Load Profiles: Temporal demand patterns
Cost Analysis: System cost breakdown
Renewable Integration: VRE utilization rates
Research Questions#
The scenario framework is designed to answer key research questions:
🔍 Primary Questions#
How does increasing smart charging reduce the need to overbuild VRE?
At what coordination level do diminishing returns occur?
What is the optimal balance between coordination complexity and system benefits?
How do different EV penetration rates affect the value of coordination?
🔬 Analysis Metrics#
VRE Capacity Requirements: Total renewable capacity needed
System Flexibility: Grid response capability
Peak Demand Reduction: Maximum load reduction
Cost-Benefit Ratio: Economic efficiency of coordination
Grid Stability Metrics: Frequency response and voltage stability
Visualization Outputs#
The scenario analysis generates comprehensive visualizations:


These visualizations help identify:
Optimal coordination levels
System planning requirements
Economic trade-offs
Grid integration challenges