

What this page will show
CapacityInstalled and new capacity by technology, zone and year.Coming
Generation and fuel useWhat each zone produces and burns, year by year.Coming
Transmission flowsNet flow on each of the 12 links, and where the model adds lines.Coming
EmissionsCO₂ by zone, province and sector against each target.Coming
System costTotal discounted cost and how it splits into capital, fixed, variable and carbon.Coming
ScenariosBaseline against policy and CER scenarios, side by side.Coming
Not results. The figure below comes from a preliminary run on placeholder parameters.
It shows the kind of output the pipeline produces, not what Canada's system will do.
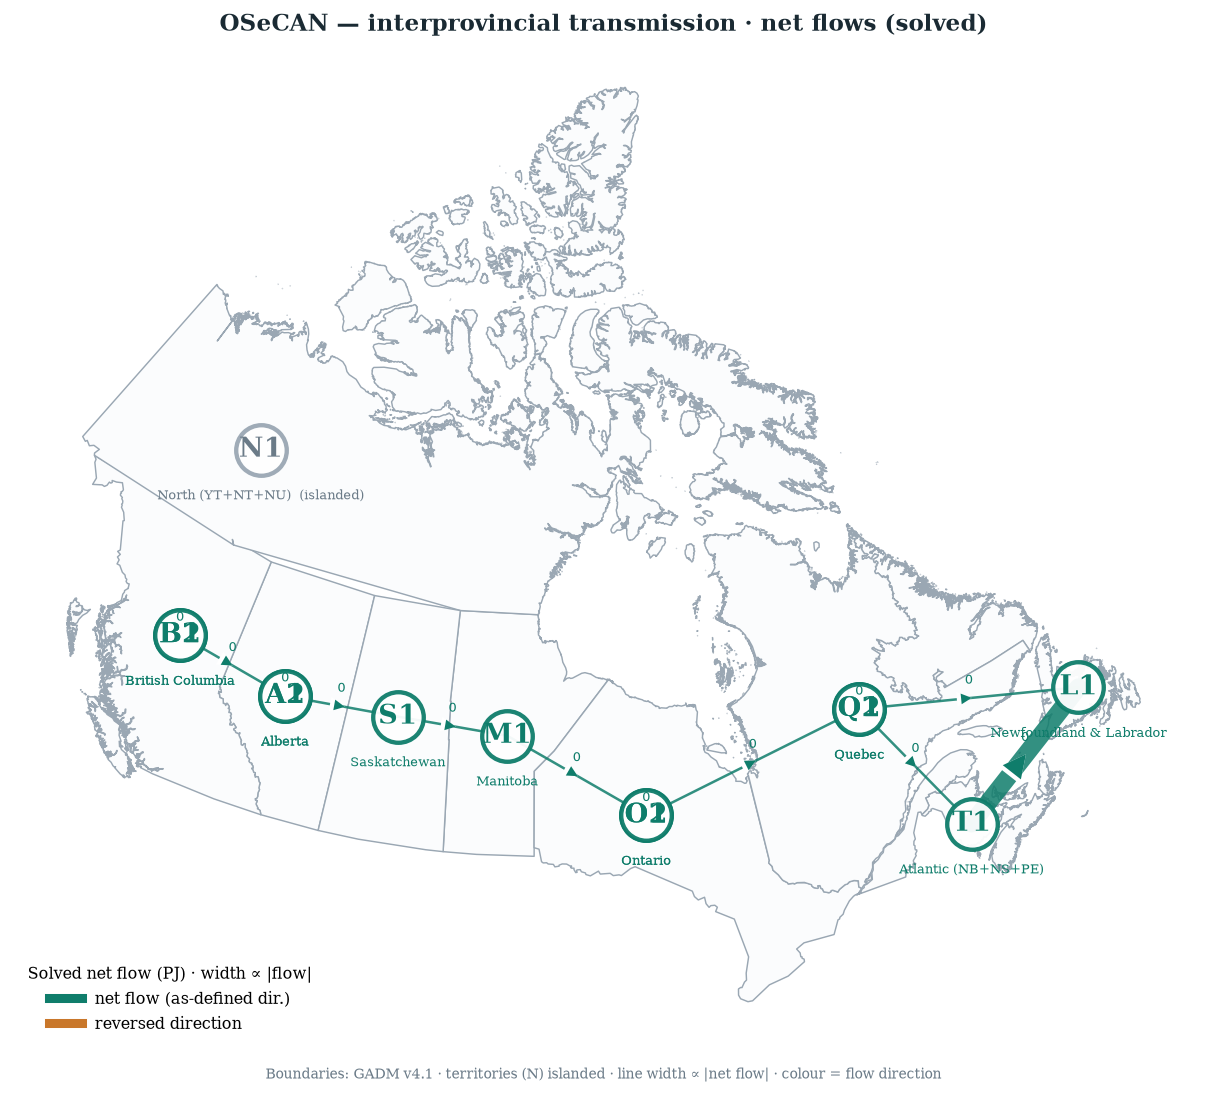
osecan map --run. Line width is proportional to net flow; boundaries from GADM v4.1. Zones in split
provinces are drawn at one point, so their labels overlap.How results are produced
osecan solve writes one CSV per OSeMOSYS result variable into results/<run>/results_csv/,
with a run record (status.json, solver log, diagnostics). osecan report turns those CSVs and the
input parameters into an HTML dashboard; osecan map --run draws the transmission map. The steps are on the
API page and the files in Model › Pipeline.